

Splunk Investigation


Did this Splunk Investigation lab using the Security Blue Team level 1 platform! I was tasked with questions that I had to find the answers to in a capture-the-flag type format!
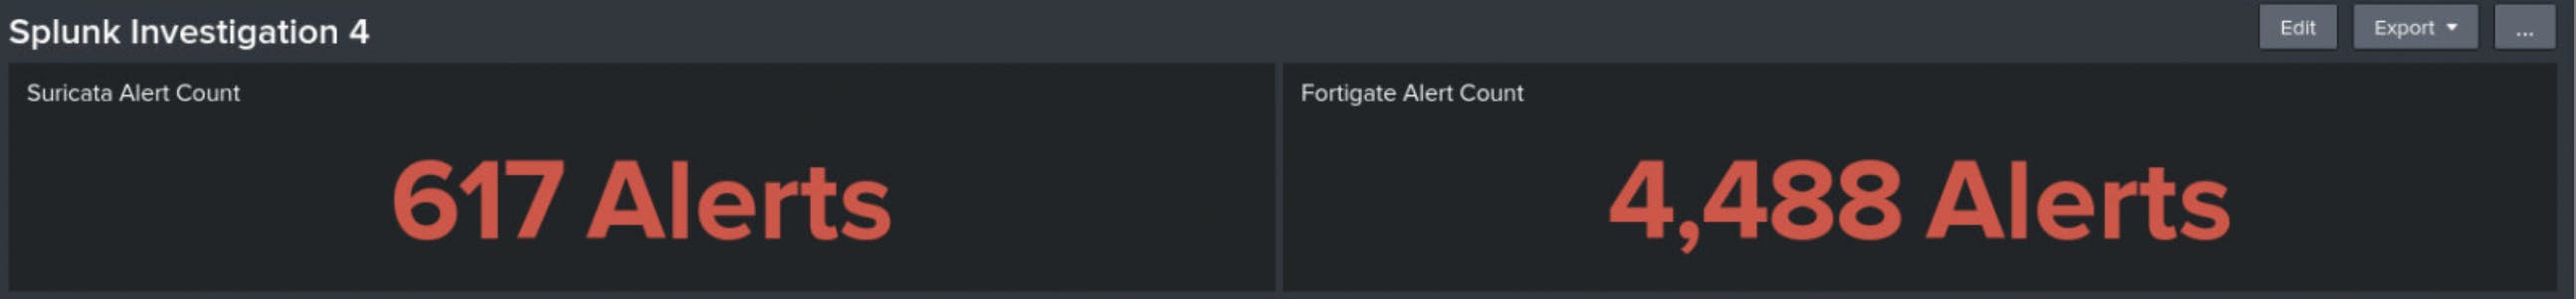
Question 1 - Click on Dashboards and go to Splunk Investigation 4. How many Suricata alerts are there, and how many Fortigate alerts are there?
First I clicked on the Search & Reporting App, then Dashboards at the top of the page. At the top of the Splunk Investigation 4 dashboard I saw two panels being used as counters for both Fortigate alerts and Suricata alerts.
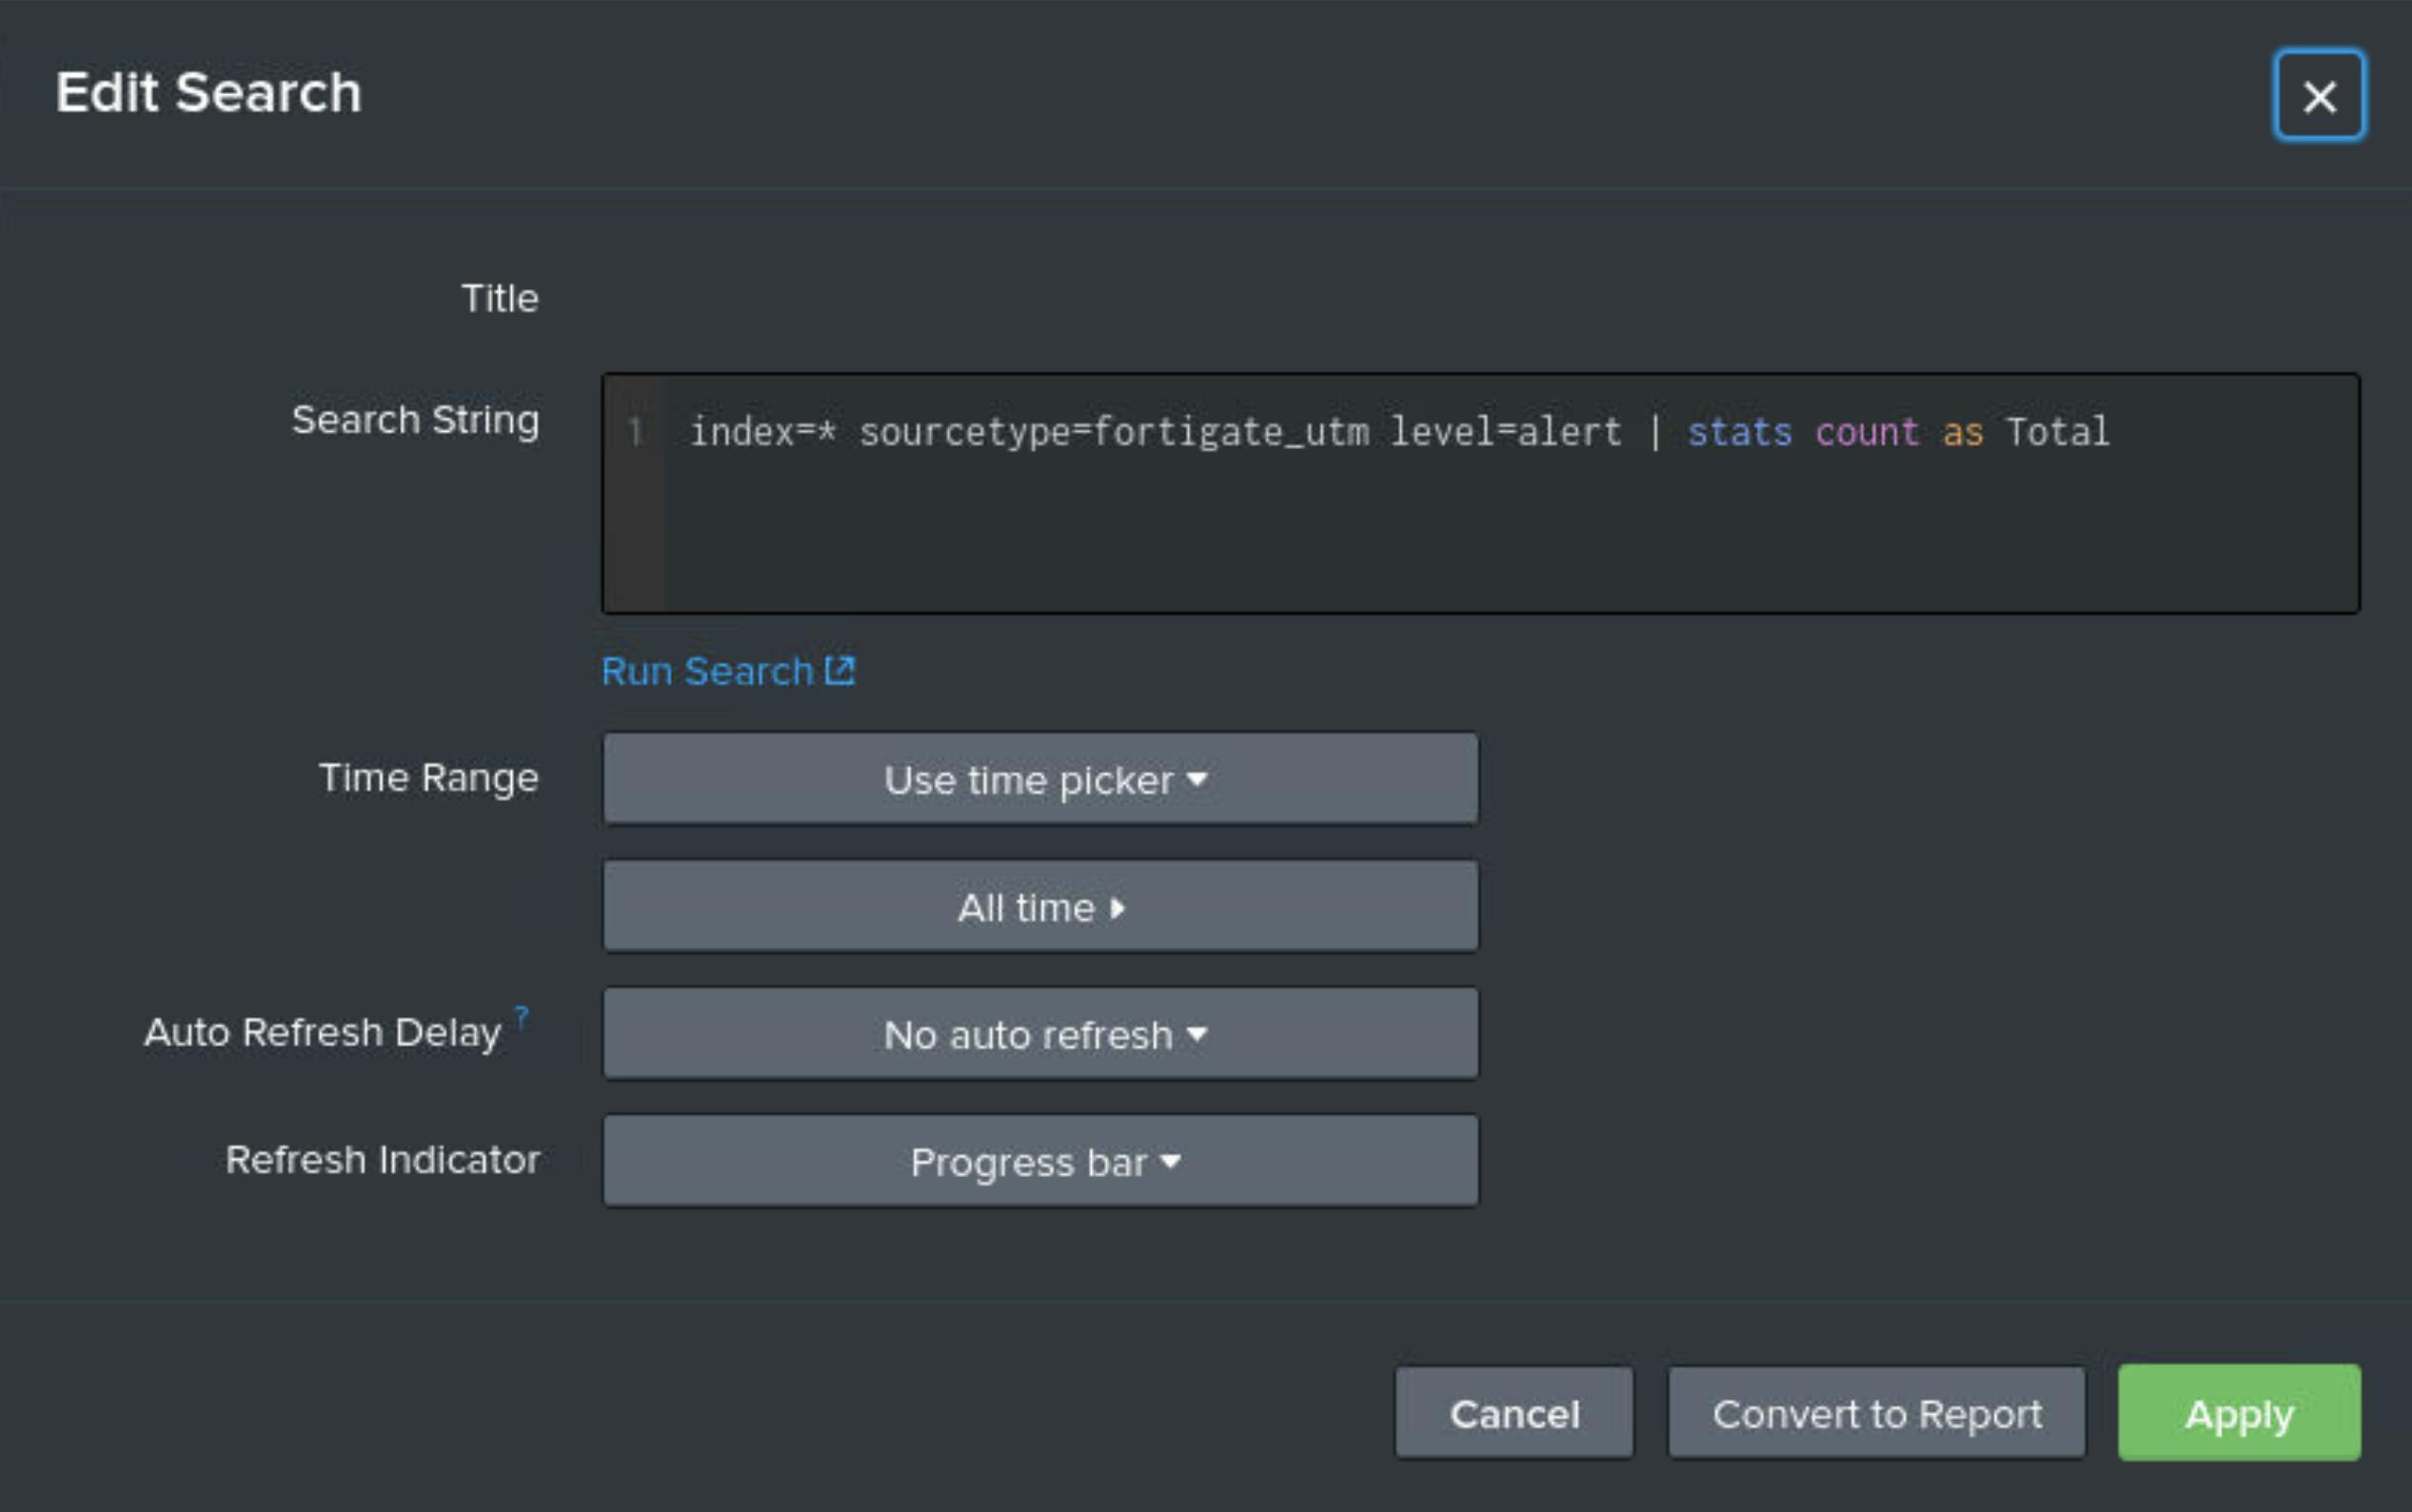
Question 2 - Edit the dashboard and look at the search query for the Fortigate Alerts counter. What is the full query used to generate this number?
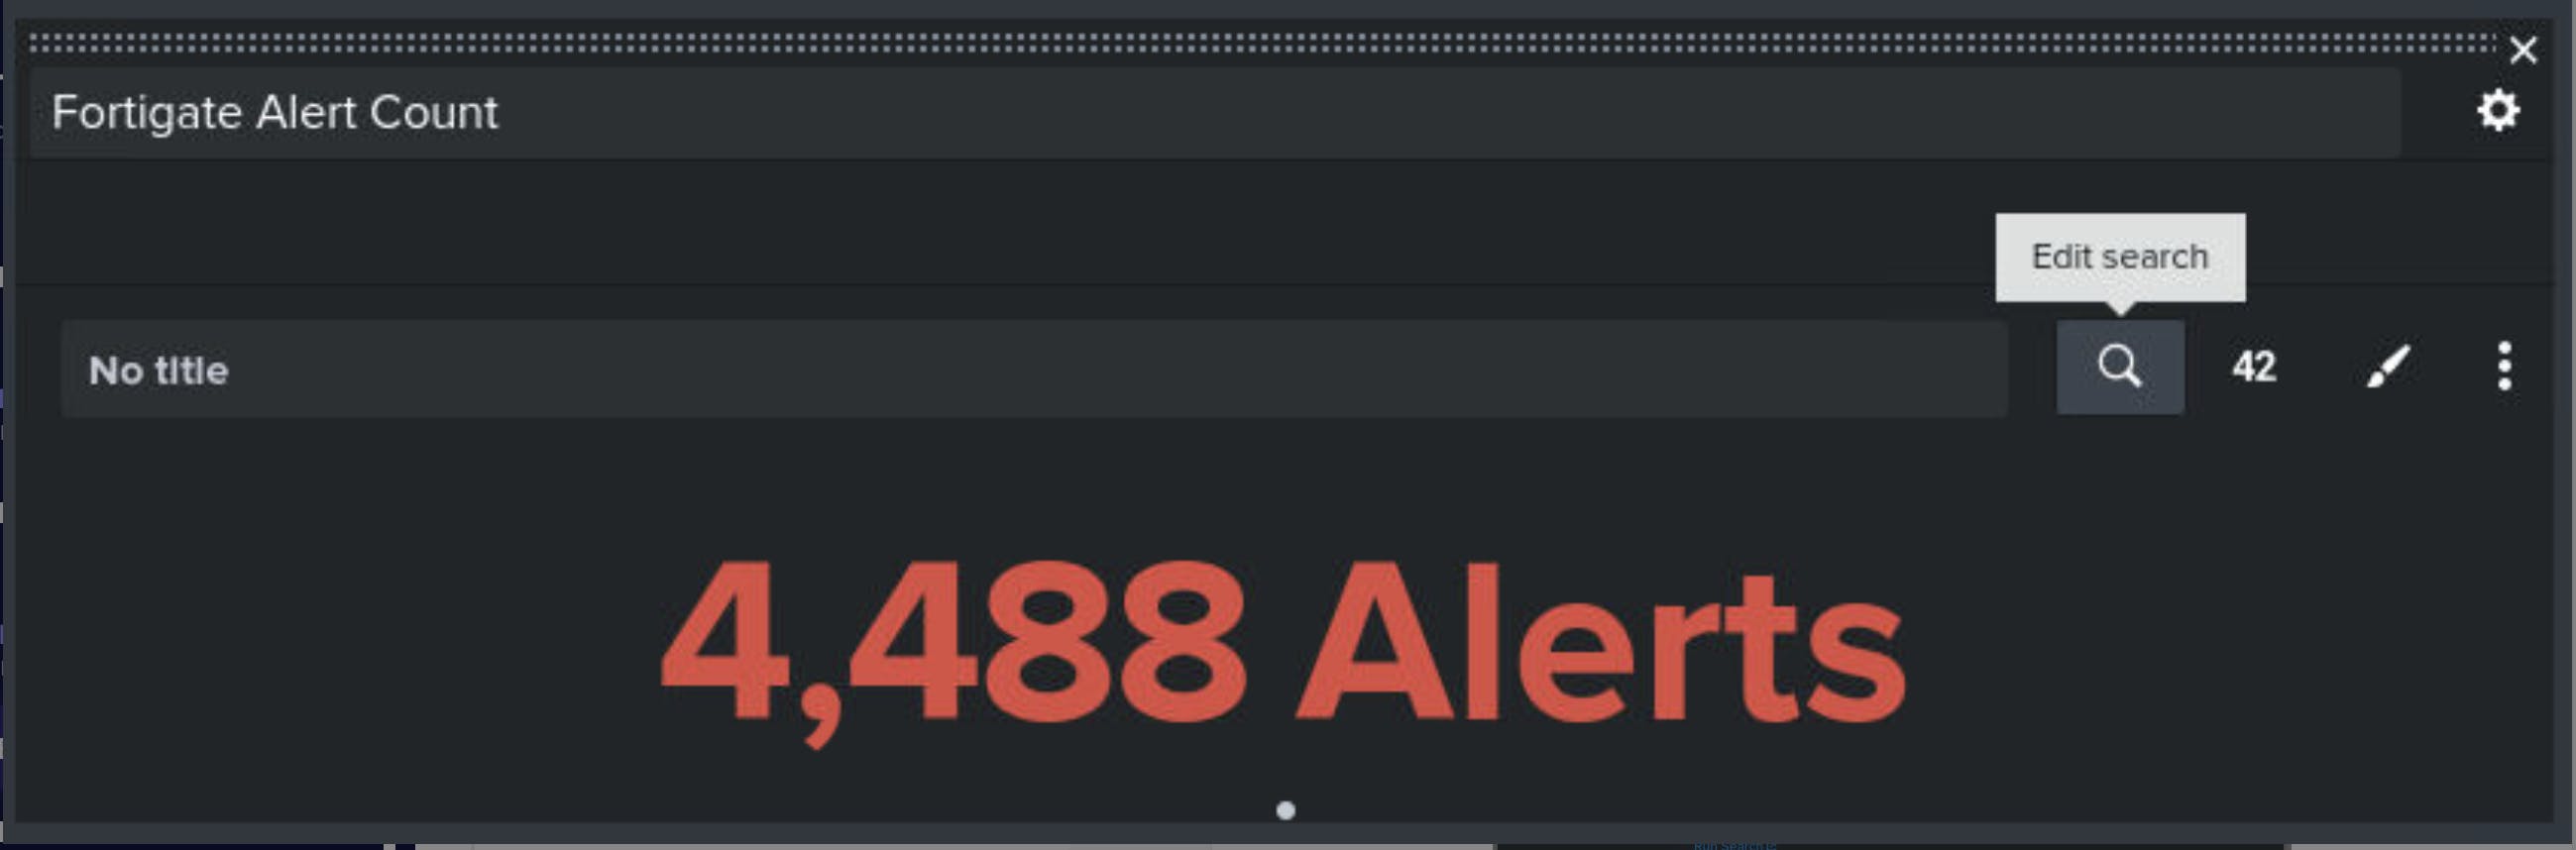
To see the search queries that are powering dashboard panels I needed to Edit the dashboard in the top right corner. Then I clicked on the magnifying glass icon of a panel, which is the ‘Edit Search’ option

Question 3 - What is the full query used to generate the Suricata Alerts counter?
I took the same actions as I did for question 2, and clicked the magnifying glass icon on the Suricata Alerts counter panel to see the search query behind it
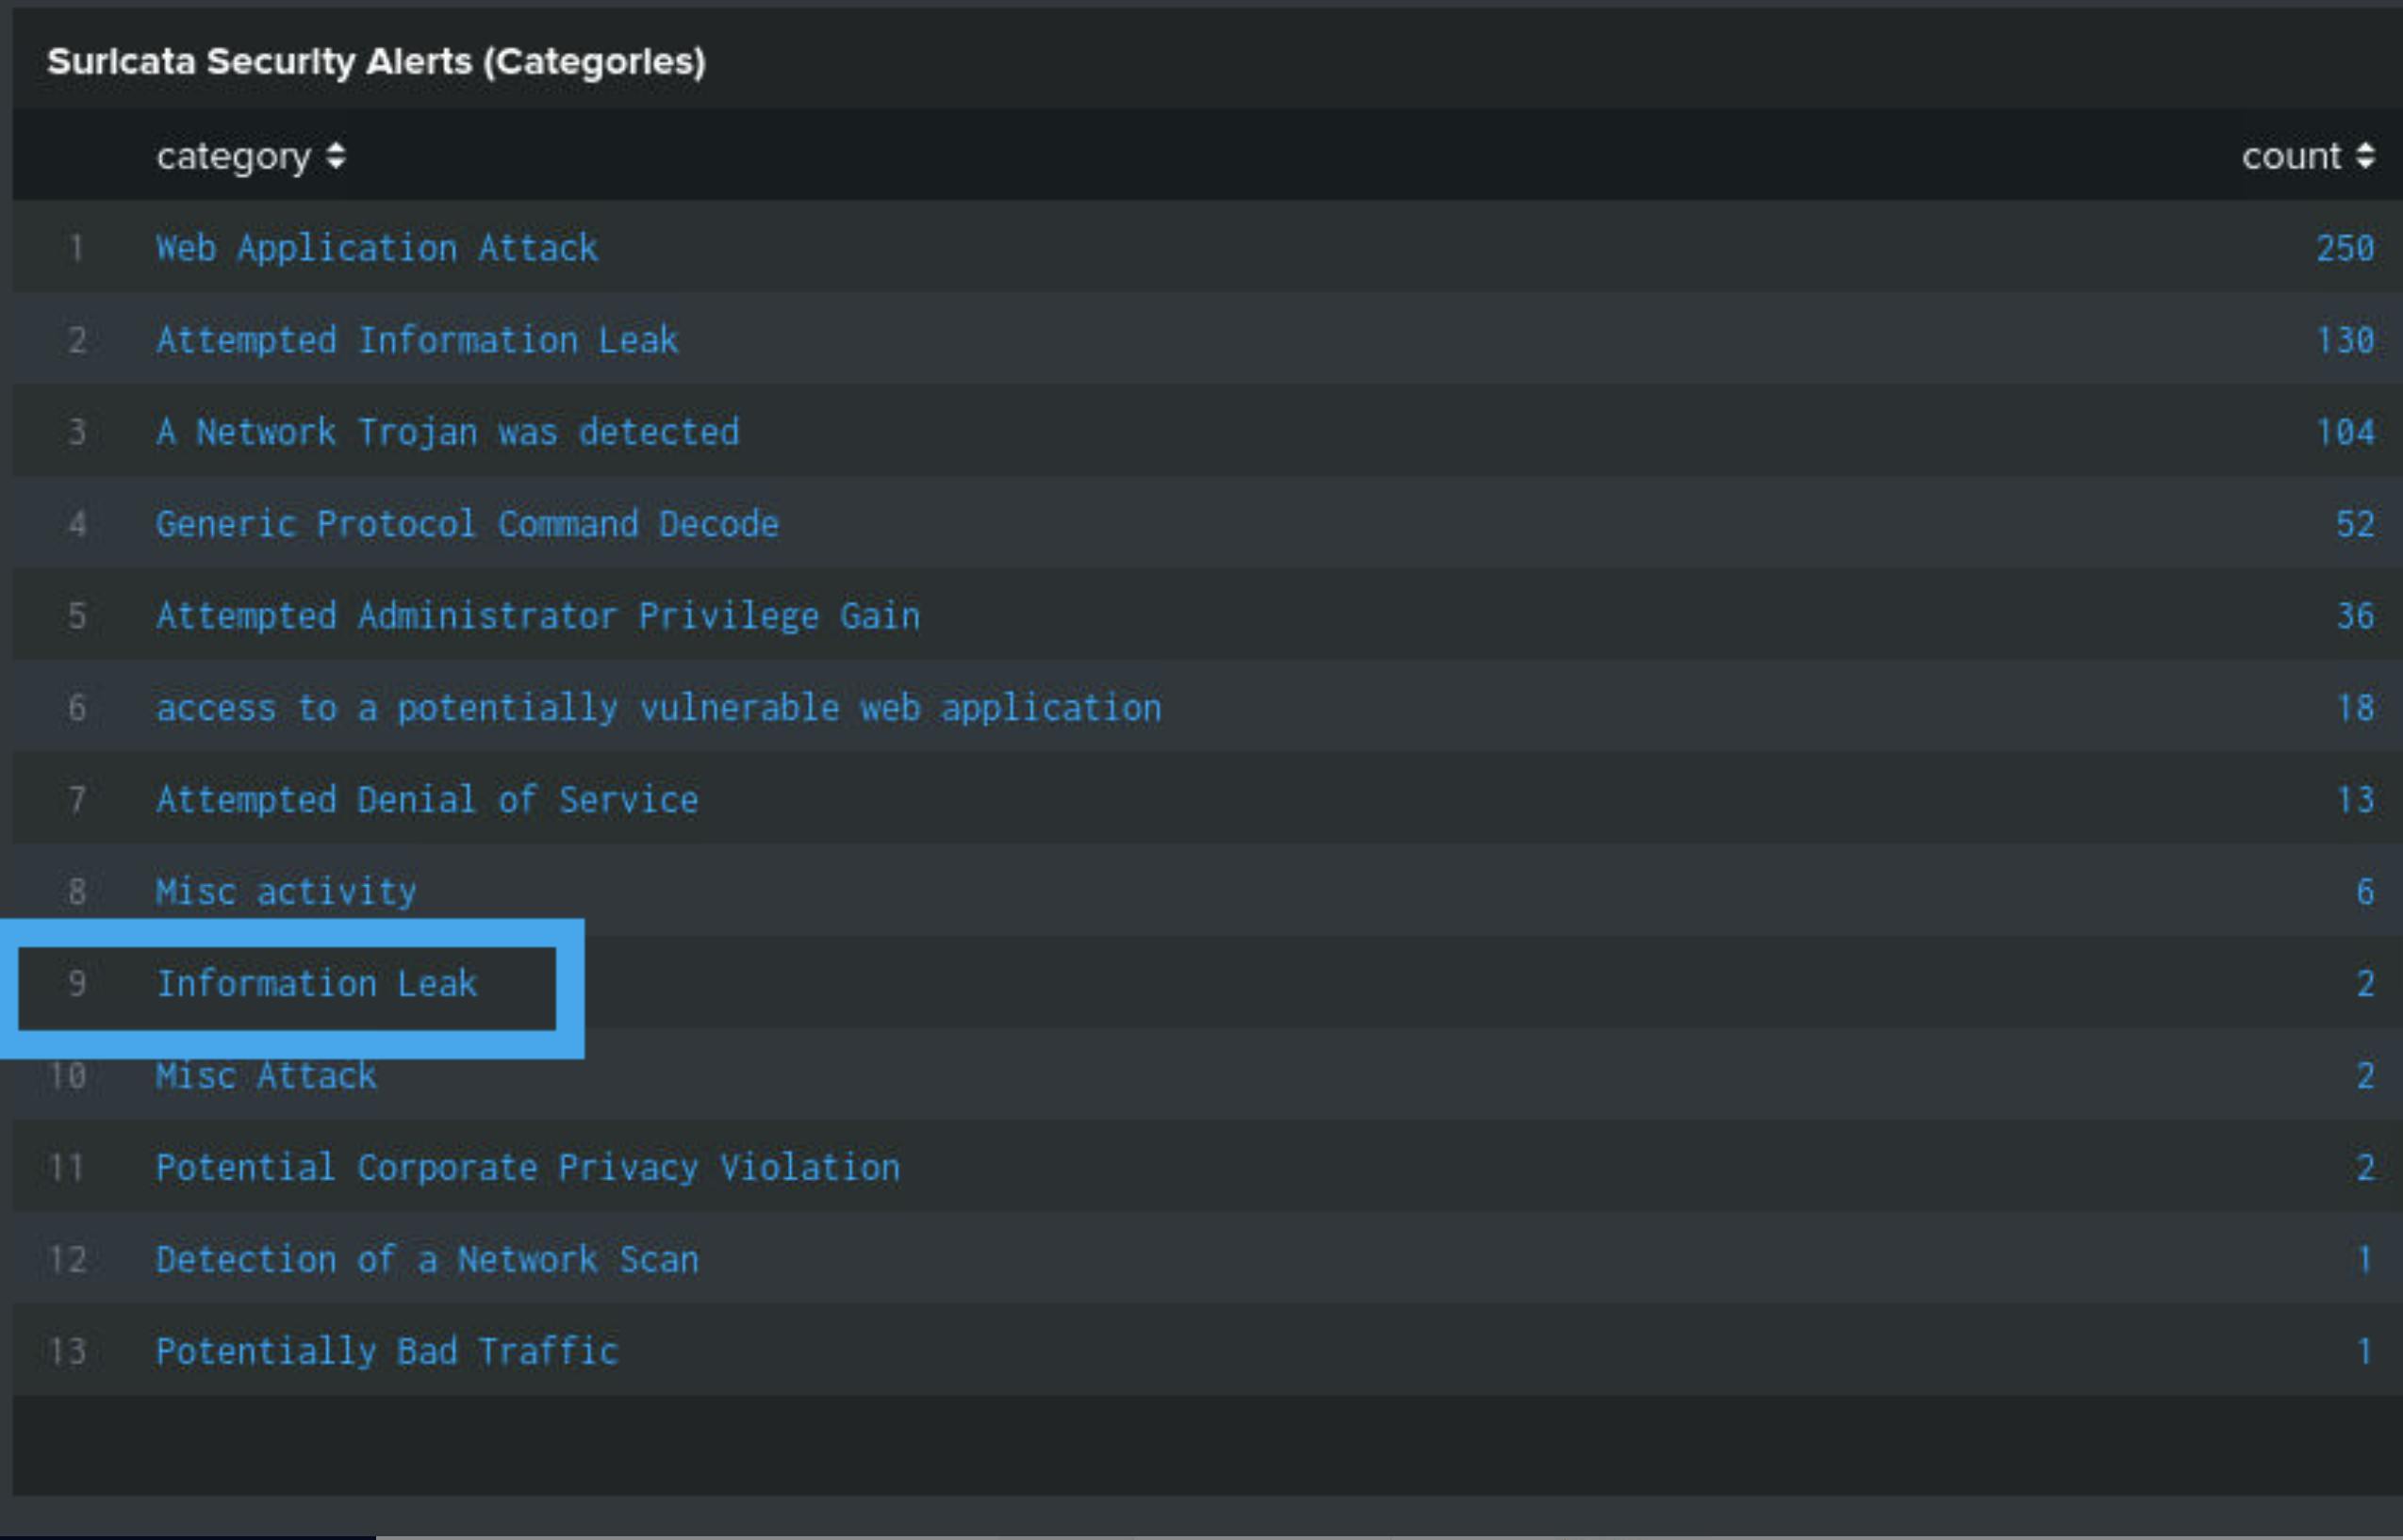
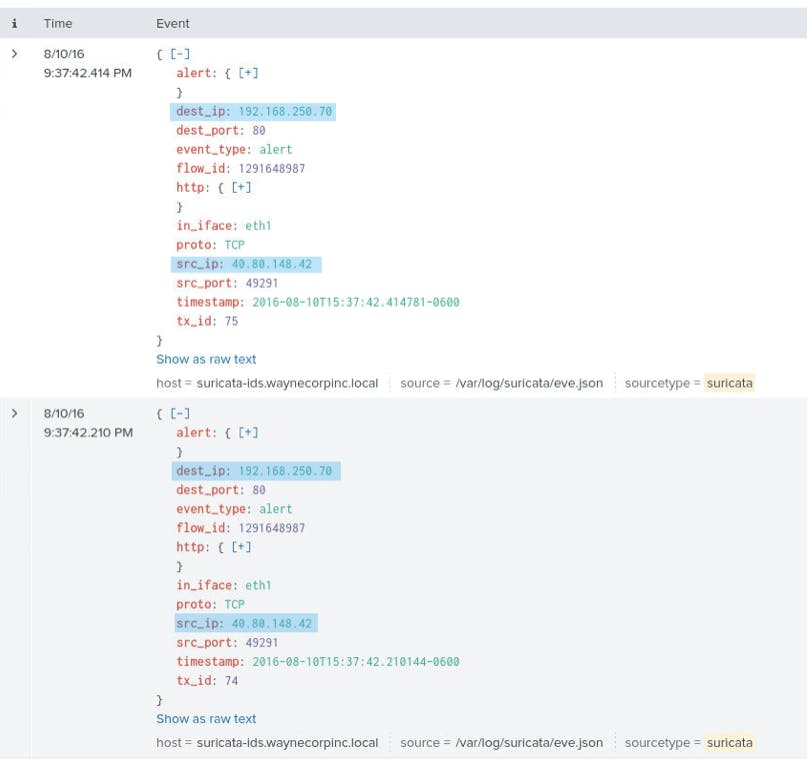
Question 4 - Click on the Suricata alert titled 'Information Leak' to see the associated events. What is the source IP address, and what is the destination IP address?
I found this alert category on Line 6 of the Suricata Alerts (Categories) table
Looking at the 2 events, I saw that dest_ip and src_ip were shown immediately, giving me my answer. The external IP 40.80.148.42 is connecting to the internal system which is hosted internally on 192.168.250.70 on port 80 (HTTP)
Question 5 - What action did Suricata take after observing these events?
Just looking at the events in the screenshot above, I couldn't see any fields that would tell me what actions Suricata took, so I clicked on 'Show as raw text' at the bottom of each event to change the displayed format. I can now see a field called ‘action’
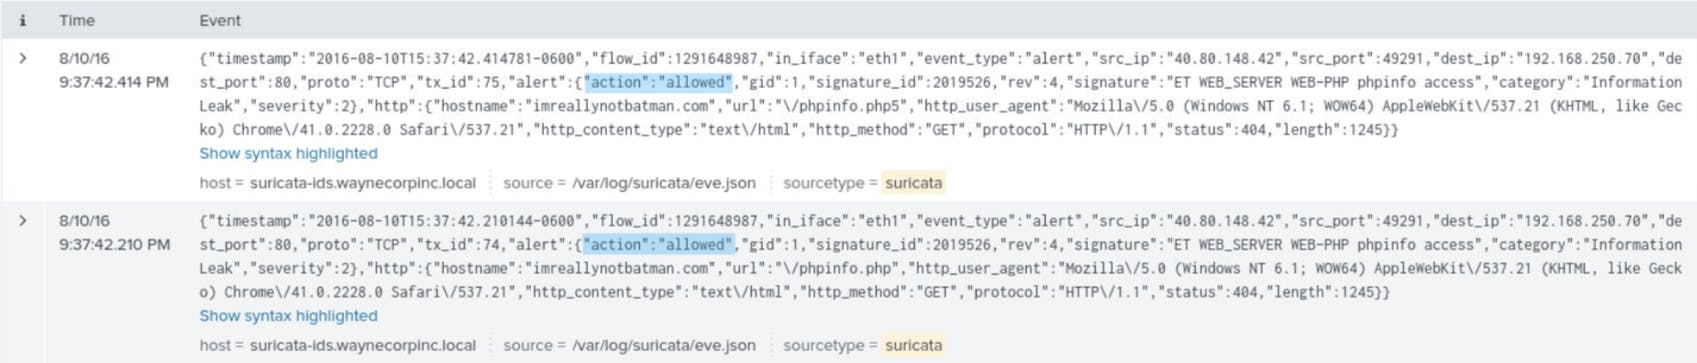
In this case, both events were allowed by Suricata. If this tool is deployed in Network Intrusion Prevention System mode (NIPS) as opposed to Network Intrusion Detection System (NIDS) then it could take actions to stop malicious connections, such as applying the ‘block’ action to end the connection!
Question 6 - We know the alert category is 'Information Leak', however the specific signature can provide us with more information about this activity. What is the signature shared by both events?
In the below screenshot, I showed two different ways to view this field within the Suricata logs. This signature is a lot less generic than the category, and I could provide context to what is actually happening.

Question 7 - Based on the logs, combine two fields to understand the full website addresses being accessed by the attacker (Remember, in some logs a "/" character must be escaped by putting a "\" in front of it. You should not reference the "\")
Looking at the logs I saw two fields that helped me answer this question: hostname and URL. Using these I could see the two targeted full URLs were:

Question 8 - What HTTP status code is returned to both of these requests, that tells us this attack was not successful?
Looking at the logs I saw a field named ‘status’, where the value is 404 for both event. This tells me that the attacker tried to reach these URLs, but there is nothing there (Error 404, Not Found).

Question 9 - Return to the Dashboard and click on the Suricata alert titled 'A Network Trojan was detected' to load this search. Modify the search query to show count of every signature field within this alert category. How many unique suricata signatures are present?
Looking at the Suricata Security Alerts (Categories) table I saw the category we want on line 3.

I was asked to identify how many signatures are found within this category of alerts. To do this I added the following to my search query to get the count of signature values: | stats count by signature. Looking at the Statistics title, I saw there are 12 unique signatures that have been observed within logs for this category.

Question 10 - Search manually through Suricata logs where the HTTP status code is 200, then perform a count of each signature field to find two signatures that reference a vulnerability CVE identifier. Search this CVE on the National Vulnerability Database.- what is the CVSS Version 3 Score?
Firstly I built a brand new search query for Suricata logs, specifically alert logs, where the status code is 200. The query looked like this: index="botsv1" sourcetype=suricata event_type=alert status=200.

Next, I need to get the count of values in the signature field. I added the following to our search: | stats count by signature.

I found the reference to a Common Vulnerability and Exposures identifier, used as an identification method for vulnerabilities. Next, I was asked to find the score of this vulnerability, so I searched for it on Google using the search “CVE-2014-6271 national vulnerability database”.


Question 11 - On the Fortigate Security Alerts dashboard table click on 'MS.Windows.CMD.Reverse.Shell'. Identify the internal IP within this event, and use your SIEM skills to identify the name of this system.
I found the associated Fortigate alert category on the final row (13) of the dashboard table.

Clicking on the row took me to a single Fortigate_UTM log. I saw that the internal IP address is in the ‘dstip’ field, and is 192.168.250.70. Because this log is from a Firewall, Fortigate has no idea what the hostname is for this system, so I needed to use a different log source to find this.

The alert is about abuse of the Microsoft Windows Command Prompt. It is possible that the internal system is running Windows, and should have Sysmon logs enabled (xmlwineventlog). So I changed a search query to look at that sourcetype and free-search the IP (without declaring a field name, because I don't know what format it will be).

Question 12 - Go back to the Fortigate Security Events table and click on 'Apache.Roller.OGNL.Injection.Remote.Code.Execution'. Find the reference field in the log and open the URL on your host machine. What is the Affected Products text, and the CVE identifier?
I found the relevant Fortigate alert category on the 10th row of the dashboard table.

Looking at the event I saw there is a field titled ‘ref’ which contains a URL.

Unfortunately, when trying to visit the URL, I got redirected to FortGuard's homepage. In the top right I saw there is a search bar, and clicking on it offers the ability to change it to an ‘ID Lookup’ search.

Next I clicked on the right search result, based on the name of the category I saw in Splunk:


Question 13 - On the dashboard consider the Fortigate category with the highest number of events. Try to find the version of the scanning tool being used, looking at Fortigate logs then Suricata logs.
I clearly see from the Fortigate alert table that ‘Acunetix.Web.Vulnerability.Scanner’ is the attack type with the most events generated.

Looking at the logs, there's nothing immediately obvious that tells me the version of this tool. There is a reference field so it's worth seeing if this will tell me the version.

However after searching it online, it didn't give me any version information.

I couldn't find anything helpful in the Fortigate logs, So I pivoted to the Suricata logs instead. I changed the sourcetype to Suricata and free-search for ‘Acunetix’ as this is the name of the scanner.

Question 14 - Investigate Suricata 'alert' logs to understand how they present the severity of the alert. Create a search query that gets the count of events based on each severity rating. When you having a working query click on 'Save As > Existing Dashboard' and select the Splunk Investigation 4 dashboard. Edit the dashboard and click on 'Select visualization' on the panel you just added to change it to a pie chart (feel free to add an appropriate title!). Hover your mouse over the 'High' section of the pie chart, what is the count%?.
I was told I need to look at Suricata alert logs, so I performed my first search using: index="botsv1" sourcetype=suricata event_type=alert.

I know the severity field is called alert.severity, I could perform a stats count for each severity. Interestingly, there is another field called ‘severity’ that is using low, high, medium ratings, which was easier for me to understand than numbers, so I used that one instead.

Now that my search worked, I saved it to my Splunk Investigation 4 dashboard using the ‘Save As’ button.

I saw the search at the bottom of my dashboard, however by default it is in the Table visualisation, and I wanted to change it to a Pie Chart. I clicked ‘Edit’ in the top right of the dashboard then clicked on the ‘Select Visualization’ button of my new panel.

Then I selected a Pie Chart from the list.

Now that the graph has been updated, I set a sub-title (2nd title field) as “Suricata Alert Severity”, then saved it

Hovering over the High section of the chart shows the count% value I needed to answer the question.
Question 15 - Complete the same steps above but for Fortigate_UTM logs, creating a pie chart based on severity. If you want to keep things neat, you can drag your new pie chart next to your Suricata one! What is the count% of critical alerts?
First I needed to understand the field name that holds the severity rating for these logs. I performed a generic search for fortigate_utm alert logs, and quickly found a field called ‘severity'

I saved it to my dashboard and converted it to a Pie Chart.

Hovering over the Critical section of the chart (or the critical text itself, which is easier) showed me the count% value I needed to answer the question.
This lab teaches how splunk would be used in a real world situation with the many different ways splunk can be used. I would definitely recommend this lab!